Technical SEO
Core Web Vitals Explained: LCP, INP and CLS Fixes That Actually Work
Speed advice is full of generic tips that don't move the numbers. This guide explains what each Core Web Vital actually measures, how to find the real bottleneck, and which fixes make the biggest difference.

Sheikh Sadikur, SEO, AEO & GEO consultant
Published · 9 min read

Core Web Vitals are Google's three measurements of real page experience: Largest Contentful Paint (LCP) measures how quickly the main content appears, Interaction to Next Paint (INP) measures how quickly the page responds to taps and clicks, and Cumulative Layout Shift (CLS) measures how much the layout jumps while loading. A page passes when LCP is 2.5 seconds or less, INP is 200 milliseconds or less and CLS is 0.1 or less, measured at the 75th percentile of real visits.
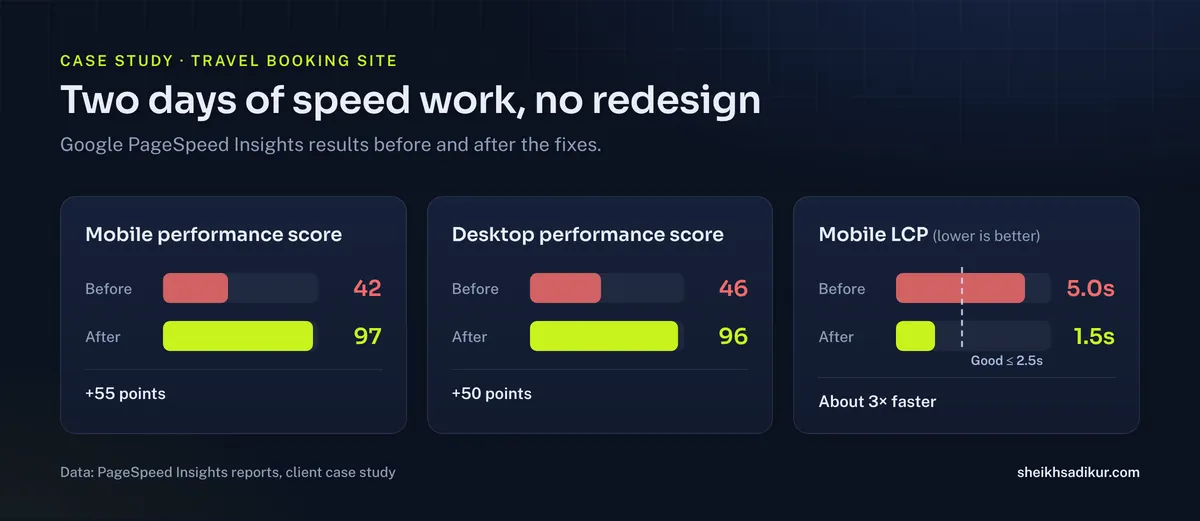
Speed work is where I see the clearest before-and-after numbers in my client projects. A travel booking site went from a mobile PageSpeed score of 42 to 97 in two days, without a redesign (case study). This guide explains how each metric works and the fixes that produced results like that.
The thresholds
| Metric | Good | Needs improvement | Poor |
|---|---|---|---|
| Largest Contentful Paint (LCP) | 2.5s or less | 2.5s to 4.0s | Over 4.0s |
| Interaction to Next Paint (INP) | 200ms or less | 200ms to 500ms | Over 500ms |
| Cumulative Layout Shift (CLS) | 0.1 or less | 0.1 to 0.25 | Over 0.25 |
INP replaced First Input Delay (FID) as a Core Web Vital in March 2024. Guides that still talk about FID are out of date.
Field data vs lab data
This distinction causes more confusion than anything else in speed work.
- Field data comes from real Chrome users visiting your site, collected in the Chrome User Experience Report (CrUX) over a rolling 28-day window. This is what Google uses to assess Core Web Vitals. You see it in Search Console's Core Web Vitals report and at the top of PageSpeed Insights, when your site has enough traffic.
- Lab data comes from a single simulated test, such as Lighthouse in PageSpeed Insights, on a throttled mobile device and network. It's ideal for diagnosing problems and comparing before and after, but it isn't what Google uses to assess your pages.
Two practical consequences:
- The PageSpeed score (0 to 100) is a lab score. It's useful, but improving it isn't the same as passing Core Web Vitals.
- Field data lags. After you fix something, field data needs up to 28 days to fully reflect it. Lab data shows the change immediately.
Lab scores also vary between runs. That's why I always test the same pages several times before and after and compare every metric, not just the headline score.
Do Core Web Vitals affect rankings?
Yes, as part of Google's page experience signals, but they're one signal among many. A slow page with the best answer can still outrank a fast page with a weak one. The bigger effect of speed is on people: visitors who wait leave, and buttons that jump get mis-tapped. For lead-generation and booking sites, that's lost revenue regardless of rankings.
LCP: how fast the main content appears
LCP measures when the largest image or text block in the viewport finishes rendering. On most pages, that's the hero image, a large heading or a banner.
Find the LCP element first
PageSpeed Insights names the LCP element in its diagnostics. Don't guess. I've seen teams compress every image on a site when the LCP element was a text heading delayed by a web font.
The four parts of LCP
LCP time can be broken into:
- Time to first byte (TTFB): how long the server takes to respond.
- Resource load delay: how long before the browser starts downloading the LCP resource.
- Resource load duration: how long the download takes.
- Element render delay: how long after download before it's painted.
Each part has different fixes:
| LCP part | Common causes | Fixes |
|---|---|---|
| Slow TTFB | Slow hosting, no caching, heavy server-side code | Page caching, CDN, better hosting |
| Load delay | LCP image discovered late (CSS background, JavaScript, lazy-loaded) | Put the image in HTML, add fetchpriority="high", preload it, never lazy-load it |
| Load duration | Large file | Modern formats such as WebP or AVIF, correct dimensions, compression |
| Render delay | Render-blocking CSS and JavaScript, web fonts | Inline critical CSS, defer non-critical JavaScript, font-display: swap |
On the travel booking site, mobile LCP dropped from 5.0s to 1.5s, so the hero and search form appeared roughly three times faster.
INP: how quickly the page responds
INP measures the delay between a user's interaction (a tap, click or key press) and the next visual update, across the whole visit. It reports one of the slowest interactions, so a single sluggish menu can fail a page.
What causes poor INP
The main thread is busy when the user interacts, usually with:
- Long JavaScript tasks (anything over 50ms blocks the main thread).
- Heavy third-party scripts: chat widgets, ad scripts, tag managers loading many tags, social embeds.
- Expensive event handlers that do too much work on each click.
- Large DOM size that makes every update slow.
Fixes that work
- Audit third-party scripts. Remove what you don't use. Load chat widgets and similar tools only after interaction or after the page has loaded.
- Break up long tasks so the browser can respond between chunks.
- Defer non-critical JavaScript with
deferor by loading it later. - Reduce DOM size, especially on page-builder sites with deeply nested elements.
- Do less work in event handlers: show visual feedback first, then do the heavy work.
Lab tools can't measure INP directly because it needs real interactions, but Total Blocking Time (TBT) in Lighthouse is a good proxy. On the travel site, mobile TBT went from 350ms to 0ms and desktop from 650ms to 0ms, so the booking form responds the moment it appears.
CLS: how much the layout jumps
CLS measures unexpected layout shifts: content moving after it has appeared, usually because something above it loaded late.
Common causes
- Images and embeds without dimensions, so the browser doesn't reserve space.
- Ads, banners and cookie notices injected above content.
- Web fonts swapping and changing text size.
- Content loaded by JavaScript that pushes existing content down.
Fixes
- Set
widthandheight(oraspect-ratio) on every image, video and iframe. - Reserve space for ads and embeds with fixed-size containers.
- Load fonts carefully: self-host, preload the main font files and use
font-display: swapwith fallback fonts of similar size. - Show notices without pushing content, for example as an overlay at the bottom of the screen.
On the travel site, mobile CLS dropped from 0.297 to 0.001, so buttons no longer moved while visitors tried to tap them.
My diagnostic process
Before changing anything, I follow the same sequence on every site:
- Check field data in Search Console and PageSpeed Insights to see which metric actually fails and on which page groups.
- Pick representative templates: homepage, a service or category page, an article or product page.
- Run lab tests on each, mobile first, three times, and record every metric.
- Identify the LCP element and its four-part breakdown.
- List long tasks and third-party scripts with their main-thread time.
- Check layout shifts in the Performance panel to see which elements move.
- Fix in order of impact, then re-test the same pages under the same conditions.
The fixes that move numbers most often
From client work, these produce the biggest gains, roughly in this order:
- Caching and a CDN. Often the biggest single TTFB improvement on WordPress sites.
- Images: correct sizes, modern formats, lazy loading below the fold only, high priority for the LCP image.
- Render-blocking CSS and JavaScript: minify, defer, remove unused code. The real estate site I audited had 21 unminified JavaScript and CSS files.
- Third-party scripts: remove, delay or replace.
- Fonts: self-host, preload, swap.
- Layout stability: dimensions and reserved space.
The full results for the travel booking site across both devices:
| Metric | Mobile before | Mobile after | Desktop before | Desktop after |
|---|---|---|---|---|
| Performance score | 42 | 97 | 46 | 96 |
| LCP | 5.0s | 1.5s | 2.8s | 0.6s |
| Total Blocking Time | 350ms | 0ms | 650ms | 0ms |
| CLS | 0.297 | 0.001 | 0.108 | 0.01 |
All of that came from work on assets, code and configuration, not design changes.
Mobile vs desktop
Mobile scores are almost always lower, and that's expected. PageSpeed Insights tests mobile on a simulated mid-range phone with a slower network, so heavy images and scripts hurt much more. Google also uses the mobile version of a page for indexing.
Prioritize mobile. A site that passes on desktop but fails on mobile is failing for most of its visitors. On the real estate site I worked on, mobile LCP went from 9.7s to 4.8s and the mobile performance score from 64 to 80, while desktop went from 86 to 98 (case study). The mobile numbers were the ones that mattered for leads, because most motivated sellers search on their phones.
Quick reference: image rules I apply on every site
- Serve images at the size they're displayed, with
srcsetfor different screens. - Use WebP (or AVIF where supported) for photos; SVG for logos and icons.
- Set
widthandheighton every image. - Lazy-load images below the fold, never the LCP image.
- Give the LCP image
fetchpriority="high". - Compress to the lowest quality that still looks right; for most photos, that's well below the camera default.
Monitoring after the fix
Speed regresses. A new plugin, a marketing script or a large uploaded image can undo weeks of work. After fixing a site, I set up:
- Monthly lab tests on the same key templates, recorded in a simple sheet.
- A check of the Core Web Vitals report in Search Console every month for new Poor URLs.
- A rule for new scripts: anything added to the site gets tested for its effect on TBT and LCP first.
- Image upload guidelines for whoever adds content: maximum dimensions and file size.
WordPress and page builders
Most of the slow sites I see run WordPress with a page builder. Common culprits:
- Too many plugins, each adding CSS and JavaScript to every page.
- Page builders generating heavy markup and loading their full asset library everywhere.
- No page caching, or a caching plugin that isn't configured.
- Unoptimized uploads: full-size camera photos used as small thumbnails.
- Sliders in the hero, which are almost always slow and rarely help conversions.
You don't have to leave WordPress to fix these. Audit plugins, configure caching properly, optimize images on upload and replace heavy hero sliders with a single optimized image.
Speed and AI search
Speed doesn't directly decide AI citations, but it matters in two ways. Pages that load slowly or render critical content late are harder for crawlers to process reliably, and AI answers draw on the same quality systems as regular search. More importantly, when an AI answer sends a visitor to your page, a slow page wastes that visit. Speed is part of the technical foundation that everything else depends on, including being cited in AI Overviews.
When speed work isn't the priority
Speed matters, but it isn't always the first problem. If key pages aren't indexed, if the content doesn't answer what people search for, or if the site has a manual action, fix those first. A fast page that Google won't index or that doesn't match search intent still brings no visitors. I usually treat speed as part of a full technical review rather than in isolation.
Frequently asked questions
What are good Core Web Vitals scores?
Google rates a page as good when Largest Contentful Paint is 2.5 seconds or less, Interaction to Next Paint is 200 milliseconds or less and Cumulative Layout Shift is 0.1 or less, measured at the 75th percentile of real user visits over 28 days.
Why is my PageSpeed score different every time I test?
PageSpeed Insights lab tests simulate a device and network, and results vary slightly between runs because of server response times, network conditions and third-party scripts. Test the same page several times, compare all metrics rather than only the score, and rely on field data for the official assessment.
How long until Search Console shows improvements?
Field data in Search Console's Core Web Vitals report is based on a rolling 28-day window of real visits, so improvements appear gradually over about four weeks after your fix goes live. Lab tests in PageSpeed Insights show the change immediately.
What replaced First Input Delay?
Interaction to Next Paint (INP) replaced First Input Delay (FID) as a Core Web Vital in March 2024. INP measures responsiveness across all interactions during a visit, not just the first one, so it catches slow menus, forms and buttons that FID missed.
Do I need a new website to fix Core Web Vitals?
Usually not. Most improvements come from caching, image optimization, removing or deferring scripts, font loading and layout fixes. The travel booking site I worked on went from 42 to 97 on mobile in two days without any redesign.